##Why Remote Debug
Sometimes, maybe your tester report an bug which you can’t reproduce in development environment; maybe it costs too much to setup the environment to reproduce the bug; maybe the issue is reported by an customer with very limited information…
Anyway, you don’t have development environment on the machine where the issue is produced. It might not help all the time, but you always have an option of doing a remote debug.
If you’re using Visual Studio, it provides a remote debug tool itself. You just need to have the pdb files and corresponding source codes in your development environment.
##How to Remote Debug
Setup on the remote machine
Something still needs to be setup on the remote machine where the issue can be reproduced.
Run the Remote Debugger tool in the remote machine.
If Visual Studio is installed in the remote machine, the tool can be found in this folder:
C:\Program Files (x86)\Microsoft Visual Studio 11.0\Common7\IDE\Remote Debugger\x64 or x86
If Visual Studio is not installed, download the tool from here:
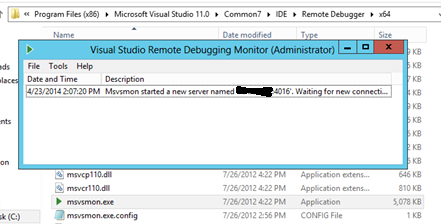
http://msdn.microsoft.com/en-us/library/bt727f1t(v=vs.110).aspxRun msvsmon.exe. The following dialog will be shown. Remember the server name and port number. It will be used to attach to the process later.

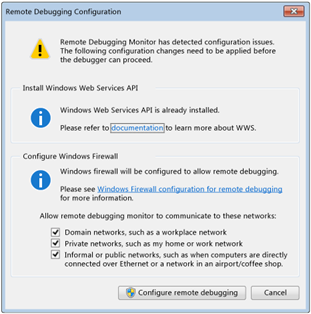
If it’s the first time running, there’s another configuration shown first, just click “Configure remote debugging”.
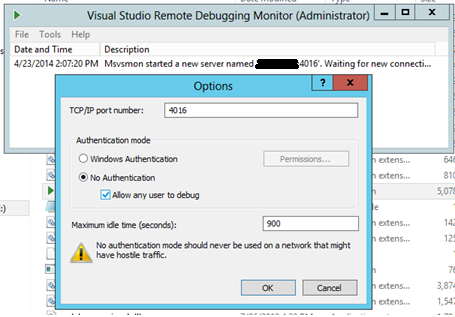
To simplify the process, let’s use no authentication while debugging. Click menu Tools->Options, make sure to choose “No Authentication” and check “Allow any user to debug”. Otherwise, you may be rejected to connect in the following steps.

Debug from the Dev machine
Sync your local codes to the revision align with the product which is installed.
Get PDB files generated during the product was built. Usually, your CI tool will have it persisted somewhere. DO NOT build the source code to get the PDB files yourself! It won’t match with binary files on the remote machine.
Copy the PDB files to your local folder. Add it to symbol location in Visual Studio so that it knows where to load the PDB files during the debug.
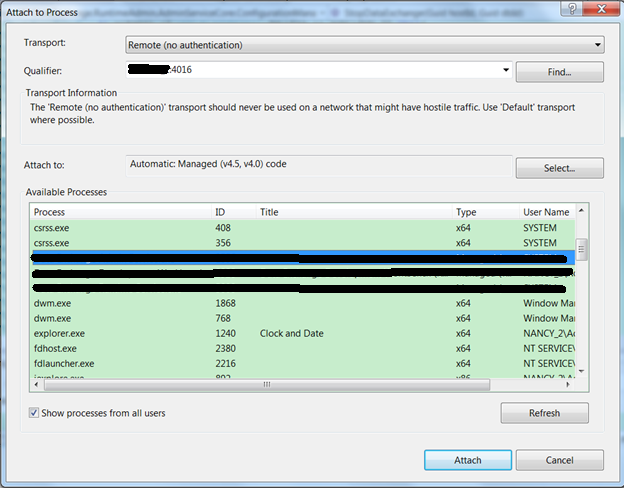
Click Debug->Attached to Process. Choose Remote (no authentication) from the dropdown list, enter the remote server name and port, and click Refresh. All the processes in the remote machine will be displayed.

Choose the process you’d like to debug and click Attach. (You can attached to multiple processes)
Double check whether symbol is loaded for the module you’d like to debug in the modules window. If it’s not, choose “Load Symbols” to load it.
Congratulations! Now you can start to debug.
However, the release build is usually optimized, so that it’s actually quite limited for we can do. For example:
- You can’t debug line by line or go inside a function in the code.
- You can’t see values of the parameters or local variables.
Basically, the best thing you can do is to setup a break point, and see whether it’s hit; if it’s hit, go check the global variable or member variable values, and then make your best guess…
But still it’s better than nothing, isn’t it? Hope you enjoy :)